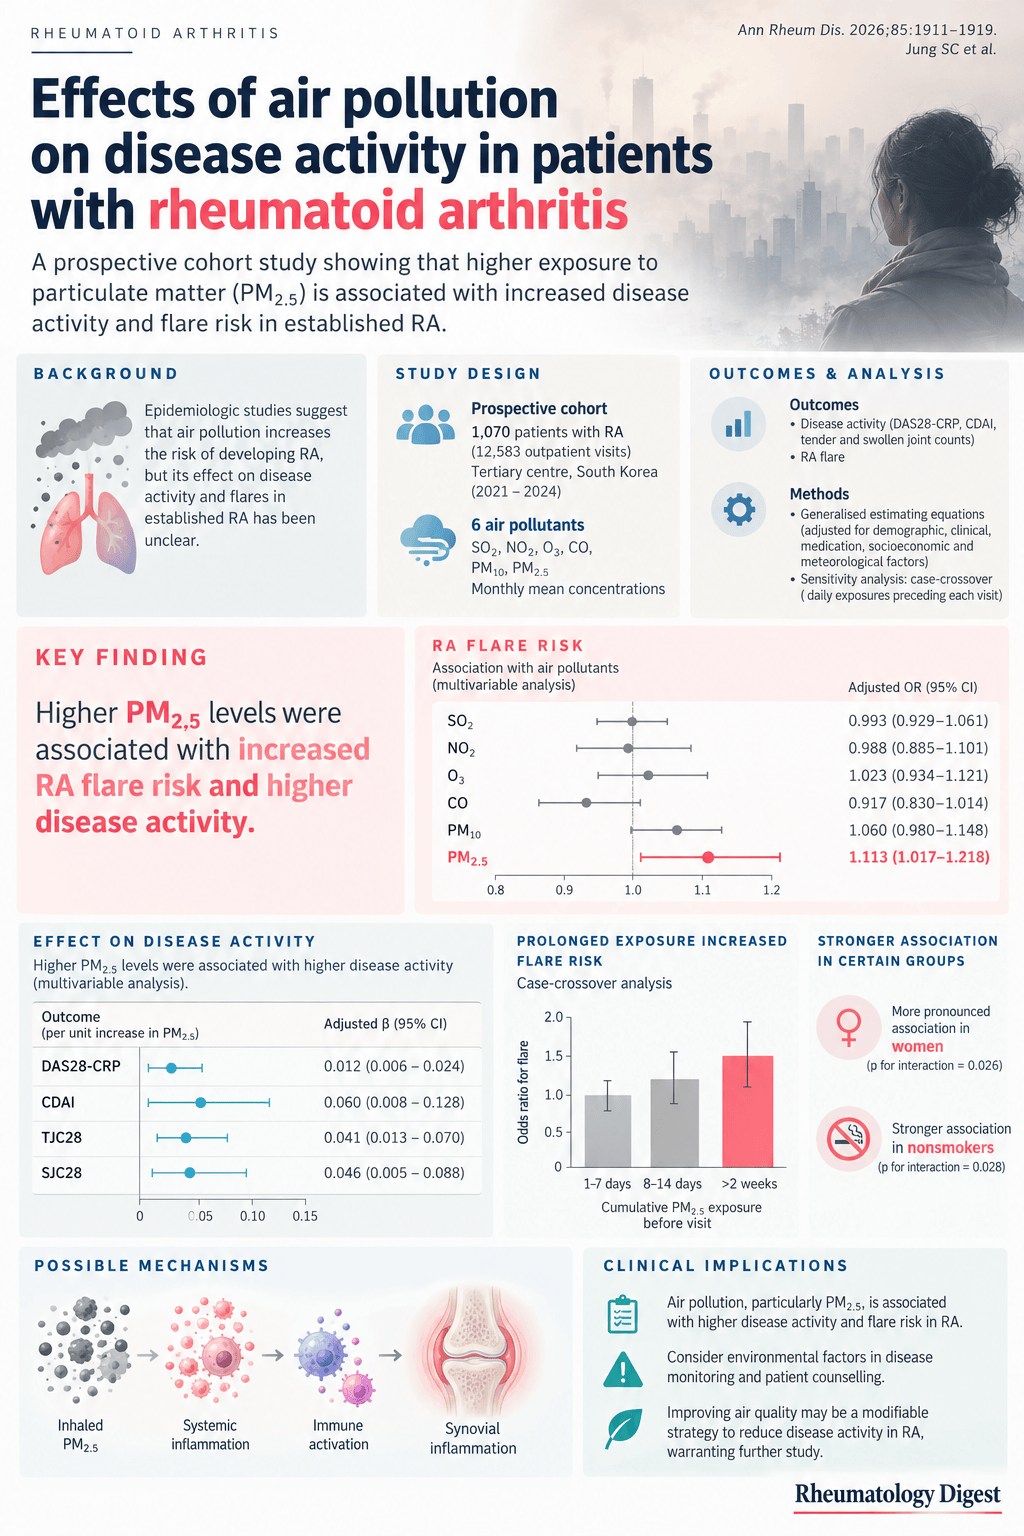
TL;DR: In a Korean RA cohort, higher PM2.5 was associated with more flares and higher disease activity, building over roughly two weeks of exposure — a modest, observational association rather than evidence that cleaner air would prevent flares.
Air pollution has been linked to the onset of rheumatoid arthritis. What happens to people who already have it is less clear, and that is the question this cohort addresses: do swings in ambient pollution track with disease activity and flares in established RA? The answer is yes for fine particles, with caveats about size, design and what an association of this kind can support.
Why look at pollution in established RA
Environmental exposures, many of them modifiable, matter in both the onset and the exacerbation of RA. Smoking is the established example, and climate factors such as temperature and humidity have been implicated too. Air pollution is a mixture of gaseous pollutants — sulfur dioxide, nitrogen dioxide, ozone and carbon monoxide — and particulate matter, classed by size: PM10 (particles of 10 µm or smaller) and PM2.5 (2.5 µm or smaller). Particles this small can reach the lower respiratory tract, inducing oxidative stress and systemic inflammatory responses.
Several epidemiological studies have connected pollution with the risk of developing RA. The authors’ point is that effects on disease activity in people who already have RA remain insufficiently studied, and earlier work on that question has been inconsistent. Some studies tied SO2 and NO2 to higher DAS28, another tied ozone to it while PM10 and NO2 went the other way, others implicated CO, NO2 and ozone, and some found no association at all. The authors suggest the heterogeneity may reflect differences in study design, pollutant composition, regional weather and patient populations.
Study design
This was a prospective cohort of RA patients treated at a single tertiary centre, Seoul National University Hospital, between January 2021 and December 2024. All met the 2010 ACR/EULAR classification criteria. Of 1,118 enrolled patients, those followed for under six months or with fewer than three outpatient visits were excluded, leaving 1,070 patients and 12,583 outpatient visits for analysis. Follow-up ran from each patient’s first visit in the study period until the last visit, death or the end of 2024.
Exposure. Monthly mean concentrations of six pollutants — SO2, NO2, ozone, CO, PM10 and PM2.5 — came from Korea’s National Institute of Environmental Research, drawn from 17 administrative regions and matched to each patient’s residential area and visit month. A modified air quality index was built from the monthly means. All pollutant concentrations were standardised to a mean of 0 and an SD of 1, so effect estimates represent the association per 1-SD increase. (For PM2.5, one SD is about 6 µg/m³.) Temperature and humidity were taken from the national meteorological service.
Outcomes. The main outcome was flare, defined as an increase in DAS28-CRP of more than 1.2 from the previous visit, or more than 0.6 if the current DAS28-CRP was 3.2 or above. Secondary outcomes were tender and swollen 28-joint counts, CDAI and DAS28-CRP.
Analysis. Generalised estimating equations accounted for repeated measures within patients, with logistic models for flare and linear models for activity measures. All models adjusted for age, sex, smoking, serologic status, time-varying glucocorticoid dose and DMARD category (none, conventional synthetic, or biologic/targeted synthetic), insurance type, an area deprivation index, and temperature and humidity.
Sensitivity analysis. Because monthly averages can hide short-term fluctuations, the authors added a case-crossover design using daily pollution data in the 603 patients with at least one flare. Each flare visit (a “case”) was compared with that same patient’s non-flare visits (the “controls”), using cumulative exposure windows from 1 to 28 days before each visit. This design controls for fixed characteristics of the individual, and the models also adjusted for calendar time, weather and concomitant medications.
The cohort
Patients were typical of a tertiary RA clinic: 86.2% women, mean age 61.3 years, mean disease duration 9.1 years, 80.8% seropositive and 6.5% smokers. At the index visit the median DAS28-CRP was 2.4 (IQR 1.7–3.3), median tender joint count 1 and swollen joint count 0, so most patients had well-controlled disease. About half (50.7%) were taking glucocorticoids, at a mean of 4.3 mg/day prednisolone-equivalent among users; 83.4% were on conventional synthetic DMARDs and 11.0% on biologic or targeted synthetic DMARDs. Interstitial lung disease was present in 3.7%. The median number of visits per patient was 11.
Pollution was generally higher in winter and spring and moved inversely with temperature. At the matched visits, the mean PM2.5 was 18.5 ± 6.0 µg/m³ and mean PM10 34.9 ± 13.2 µg/m³. The modified air quality index was highest in January and lowest in September. The regions differed: Incheon had the highest SO2 and CO, Gyeonggi-do and Chungcheongnam-do the highest PM10 and PM2.5, and Seoul the highest NO2.
Flare incidence
Over 3,235 person-years there were 1,278 flare events in 604 patients, an incidence of 39.5 per 100 person-years (95% CI 37.4–41.7), or 10.2 per 100 outpatient visits. The monthly share of visits with a flare was highest in January (0.124) and lowest in April (0.086). The seasonal peak coincides with the season of heaviest pollution, which is exactly why temperature and humidity adjustment, and in the sensitivity analysis calendar-time adjustment, matter here.
Pollution and flare risk
The overall index first: higher modified air quality index was associated with flare risk, adjusted OR 1.115 (95% CI 1.020–1.219).
By pollutant, only PM2.5 reached significance. In the multivariable model:
- PM2.5: adjusted OR 1.113 (95% CI 1.017–1.218; P = .020) per 1-SD increase
- PM10: 1.060 (0.980–1.148), not significant
- Ozone: 1.023 (0.934–1.121), not significant
- SO2: 0.993, NO2: 0.988 — no association
- CO: 0.917 (0.830–1.014), not significant, with the point estimate in the protective direction
The unadjusted PM2.5 estimate was weaker and short of significance (OR 1.055; 95% CI 0.997–1.116; P = .062). The significant result therefore emerges after adjustment, and six pollutants were tested; the paper describes no correction for that. The authors also report an E-value of 1.47 for PM2.5: an unmeasured confounder associated with both PM2.5 and flare by a risk ratio of about 1.47 could, in principle, explain the result away.
Pollution and disease activity
Higher PM2.5 was the only pollutant associated with all four activity measures after adjustment (per 1-SD increase):
| Measure | Adjusted β (95% CI) |
|---|---|
| DAS28-CRP | 0.031 (0.009–0.053) |
| CDAI | 0.171 (0.039–0.302) |
| Tender joint count | 0.064 (0.010–0.119) |
| Swollen joint count | 0.046 (0.005–0.088) |
Other pollutants showed scattered associations: PM10 with DAS28-CRP (β 0.020; 0.001–0.039) and ozone with swollen joint count (β 0.045; 0.003–0.088). The modified air quality index was also associated with higher overall disease activity. Spline models showed DAS28-CRP and CDAI trending upward with rising PM2.5.
Size of the effect. A 1-SD rise in PM2.5 corresponded to roughly 0.03 points of DAS28-CRP and under 0.2 points of CDAI. For scale, the study’s own flare definition is a DAS28-CRP rise of more than 1.2. The authors call the effects “relatively modest”, and these figures show why: the associations are statistically detectable across 12,583 visits but small at the individual-visit level.
Who was more affected
The association between PM2.5 and DAS28-CRP differed by subgroup (effect per 10 µg/m³):
- Women: β 0.061 (0.023–0.099) versus men −0.004 (−0.064 to 0.056); P for interaction .026
- Non-smokers: β 0.058 (0.021–0.095) versus smokers −0.023 (−0.089 to 0.043); P for interaction .012
- Higher baseline tender joint count (≥2): β 0.076 versus 0.036 for those with fewer than two, a borderline interaction (P = .058)
No significant modification was found by age, hypertension, diabetes, chronic kidney disease, ILD, DMARD use, glucocorticoid dose or swollen joint count, and the flare association was not significantly modified by any clinical factor.
The authors offer two interpretations, and both are speculative. The smoker result may reflect airways already chronically inflamed or maximally activated by smoking, so that ambient PM2.5 adds little — they point to similar findings in COPD, where PM2.5-induced neutrophilic airway inflammation was found mainly in non-smokers. And patients with higher baseline tender joint counts may represent a more inflamed state, more responsive to further inflammatory stimuli. The sex difference is reported without a specific explanation.
The case-crossover result: it is about cumulative exposure
The sensitivity analysis included 8,024 outpatient visits in the 603 patients with at least one flare: 1,278 case visits and 6,746 control visits. It supported the main findings.
- PM2.5 was associated with higher flare risk across most lag periods, but not for the single-day lag or the 1–7-day window.
- Longer cumulative exposure windows carried higher odds, with the association becoming more pronounced once the window extended beyond about 14 days.
- Exposure–response curves suggested positive dose-dependent associations between PM2.5 and flare.
This is the most informative finding about timing. The authors note that short-term increases in PM2.5 were not associated with an immediate rise in flare risk; prolonged exposure to higher PM2.5 was, suggesting that cumulative exposure over weeks matters more than a transient peak. For clinical use, that argues against reading a single bad-air day as a flare trigger.
How the authors think pollution might act
The proposed mechanism is oxidative. PM2.5 particles are smaller than red blood cells, can reach the alveolar ducts and capillaries, and may spread through the circulation to distant organs. They can generate reactive oxygen species through several routes — direct metal–cell interaction, increased oxidase activity, and calcium channel activation in the cell membrane — and have been linked to endoplasmic reticulum stress and mitochondrial DNA damage. Reactive oxygen species can activate NF-κB and drive production of TNF-α and IL-1, promoting synovial inflammation. The authors also note that pollution has been linked to lung inflammation and induction of bronchus-associated lymphoid tissue, which might promote anti-citrullinated peptide antibodies, and that pollutants may directly contribute to joint inflammation and erosion. This section is a hypothesis; the study measured exposure and disease activity, not any of these intermediate steps.
Why Korea, and why it matters
South Korea has had relatively high ambient pollution compared with many OECD countries. The authors cite OECD reporting that it had the highest mean population exposure to PM2.5 among OECD countries in 2013, and note that the 2024 World Air Quality Report ranked it 55th of 138 countries for annual average PM2.5. Their argument is that with exposure that widespread and persistent, even a modest per-patient effect could carry public health significance.
Limitations stated by the authors
- Exposure was assigned, not measured. It was estimated from residential area, so individual exposure, which depends on time outdoors, mask use and indoor air purification, may differ. Relocation during follow-up could introduce misclassification.
- Lung disease was not captured. There were no data on pneumonia, asthma or COPD, which might mediate the response to pollution.
- Unmeasured confounding is possible, as the E-value shows.
- Only Korean patients were included, so findings may not generalise to other environmental, geographic or ethnic settings. It was also a single tertiary centre.
- Effects were modest. Most patients had well-controlled RA, and the authors suggest the impact may be larger in patients with higher baseline disease activity — untested here.
- RA-associated ILD flares were not studied, and the authors flag that as a future question.
Funding came from Korean government health and industry grants, with salary support for one author from the US National Institutes of Health. One author reports a speaker fee from Boehringer Ingelheim and a consultant fee from Priovant Therapeutics.
What it adds up to
The study adds longitudinal, real-world data to a literature that had been inconsistent. In 12,583 visits across four years, PM2.5 was the pollutant that tracked consistently with flare risk and with all four disease activity measures, the direction held in a within-patient case-crossover analysis that removes fixed individual differences, and the exposure window that mattered was weeks, not days.
Three things temper it. The effect per visit is small — a few hundredths of a DAS28 point per SD. The flare association is statistically significant only after covariate adjustment, among six pollutants tested. And this is an observational association from one centre, so it cannot show that reducing exposure would reduce flares. The authors themselves say further studies are needed to establish whether improving air quality lowers disease activity in RA.
Their practical conclusion is that clinicians should encourage patients to minimise exposure to poor air quality, and that policymakers should treat air quality as part of reducing the burden of chronic disease, while noting that external validation is still needed. What the data support is narrower: a plausible, modest, cumulative-exposure signal for PM2.5 that adds air quality to the list of environmental factors worth asking about.
Disclosures noted in the source: grants from the Korea Health Industry Development Institute and related Korean government programmes; one author reports speaker and consulting fees from industry, listed in the paper. No patient or public involvement in design or conduct. Parts of the results were presented at ACR Convergence 2025.